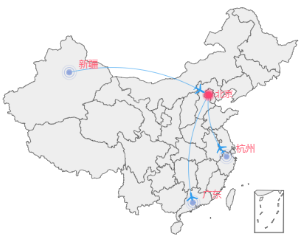
1
2
3
4
5
6
7
8
9
10
11
12
13
14
15
16
17
18
19
20
21
22
23
24
25
26
27
28
29
30
31
32
33
34
35
36
37
38
39
40
41
42
43
44
45
46
47
48
49
50
51
52
53
54
55
56
57
58
59
60
61
62
63
64
65
66
67
68
69
70
71
72
73
74
75
76
77
78
79
80
81
82
83
84
85
86
87
88
89
90
91
92
93
94
95
96
97
98
99
100
101
102
103
104
105
106
107
108
109
110
111
112
113
114
115
116
117
118
119
120
121
122
123
124
125
126
127
128
129
130
131
132
133
134
135
136
137
138
139
140
141
142
143
144
145
146
147
148
149
150
151
152
153
154
155
156
157
158
159
160
161
162
163
164
165
166
167
168
169
170
171
172
173
174
175
176
177
178
179
180
181
182
183
184
185
186
187
188
189
190
191
192
193
194
195
196
197
198
199
200
201
202
203
204
205
206
207
208
209
210
211
212
213
214
215
216
217
218
219
220
221
222
| <template>
<div>
<h3>Vue + echarts4.9 基本地图</h3>
<div id="daFeiMap" ref="daFeiMap" />
</div>
</template>
<script>
/*
* main.js 全局注册
* import echarts from 'echarts'
* Vue.prototype.$echarts = echarts
* import 'echarts/map/js/china';
*
* 使用 this.$echarts.init()
* */
import echarts from 'echarts'
import 'echarts/map/js/china'; // 这个主要执行了 echarts.registerMap('china', " china.json 数据 ");
const planePath =
'path://M1705.06,1318.313v-89.254l-319.9-221.799l0.073-208.063c0.521-84.' +
'662-26.629-121.796-63.961-121.491c-37.332-0.305-64.482,36.829-63.961,' +
'121.491l0.073,208.063l-319.9,221.799v89.254l330.343-157.288l12.238,' +
'241.308l-134.449,92.931l0.531,42.034l175.125-42.917l175.125,' +
'42.917l0.531-42.034l-134.449-92.931l12.238-241.308L1705.06,1318.313z';
export default {
data () {
return {
msg: '涟漪特效动画 effectScatter',
geoCoordMapChina: { // 出发地 -------------------------地区坐标自行找坐标资料
'新疆': [87.36, 43.45],
'北京': [116.413554, 39.911013],
'杭州': [120.161693, 30.280059],
'广东': [113.14, 23.08],
},
destinationMsg: { // 目的地
name: "北京", value: [116.413554, 39.911013, ""]
},
planePath: planePath
}
},
mounted() {
this.drawMap();
},
methods: {
drawMap() {
let planePath = this.planePath; // fei_tip: 见下面
// 接口给的数据格式---可以考虑用这种格式
let seriesData = [ // todo: 接口数据
{"name": "杭州", "value": ""},
{"name": "广东", "value": ""},
{"name": "新疆", "value": ""}
];
let resData = this.convertData(seriesData)
const myChart = echarts.init(this.$refs.daFeiMap)
const mapBoxOption = {
geo: { // 地理坐标系
show: true,
map: 'china',
},
series: [
{ // 基本地图
type: 'map',
mapType: 'china',
},
{ // fei_tip:线路---航线
type: 'lines',
symbolSize: 10,
effect: { // 航线动态
show: true,
period: 6,
trailLength: 0,
symbol: planePath,
symbolSize: 15
},
lineStyle: {
color: '#2d9df1', //航线的颜色
width: 1,
opacity: 0.6,
curveness: 0.2 // 弯曲程度
},
// data: [
// {
// "fromName": "杭州",
// "toName": "北京",
// "coords": [[120.161693, 30.280059], [116.413554, 39.911013, ""]],
// "value": [116.413554, 39.911013, ""]
// },
// {
// "fromName": "广东",
// "toName": "北京",
// "coords": [[113.14, 23.08], [116.413554, 39.911013, ""]],
// "value": [116.413554, 39.911013, ""]
// },
// {
// "fromName": "新疆",
// "toName": "北京",
// "coords": [[87.36, 43.45], [116.413554, 39.911013, ""]],
// "value": [116.413554, 39.911013, ""]
// }
// ],
data: resData.resResult
},
{ // fei_tip: 出发地
type: 'effectScatter',
coordinateSystem: 'geo', // fei_tip: 使用地理坐标系
rippleEffect: { //涟漪特效
period: 4, //动画时间,值越小速度越快
brushType: 'stroke', //波纹绘制方式 stroke, fill
scale: 4 //波纹圆环最大限制,值越大波纹越大
},
label: {
show: true,
position: 'right', //显示位置
offset: [5, -10], //偏移设置
formatter: function (params) { // 圆环显示文字
return params.data.name;
},
fontSize: 13,
color: '#ff6b81',
},
symbol: 'circle',
symbolSize: function (val) {
return 6; //圆环大小
},
itemStyle: {
show: true,
color: '#90a5dc' // 圆环颜色
},
// data: [
// {name: '杭州', value: [120.161693, 30.280059, ""]},
// {name: '广东', value: [113.14, 23.08, ""]},
// {name: '新疆', value: [87.36, 43.45, ""]},
// ]
data: resData.resFromResult
},
{ // 目的地样式---北京
type: 'effectScatter',
coordinateSystem: 'geo',
label: {
show: true,
position: 'right',
formatter: '{b}',
color: '#ff6b81'
},
symbolSize: function (val) {
return 8
},
itemStyle: {
color: '#fe4272',
},
data: [
// {name: "北京", value: [116.413554, 39.911013, ""]},
this.destinationMsg
]
}
],
}
myChart.setOption(mapBoxOption)
},
/**
* 数据处理
* @param resData
* @returns {{resFromResult: *[], resResult: *[]}}
*
*
* resResult 数据格式
* [
* {
* "fromName": "杭州",
* "toName": "北京",
* "coords": [[120.161693, 30.280059], [116.413554, 39.911013, ""]],
* "value": [116.413554, 39.911013, ""]
* }
* ]
*
* resFromResult 数据格式
* [
* {
* "name": "杭州",
* "value": [120.161693, 30.280059]
* }
* ]
*
*/
convertData(resData) {
let resResult = []; // 航线覆盖地址
let resFromResult = []; // 飞行来源地址
for (let i = 0; i < resData.length; i++) {
let fromCoord = this.geoCoordMapChina[resData[i].name];
resResult.push({
fromName: resData[i].name,
toName: this.destinationMsg.name,
coords: [fromCoord, this.destinationMsg.value],
value: this.destinationMsg.value
})
resFromResult.push({
name: resData[i].name,
value: fromCoord
});
}
return {resResult, resFromResult};
},
},
};
</script>
<style scoped>
#daFeiMap {
width: 500px;
height: 480px;
}
</style>
|

